
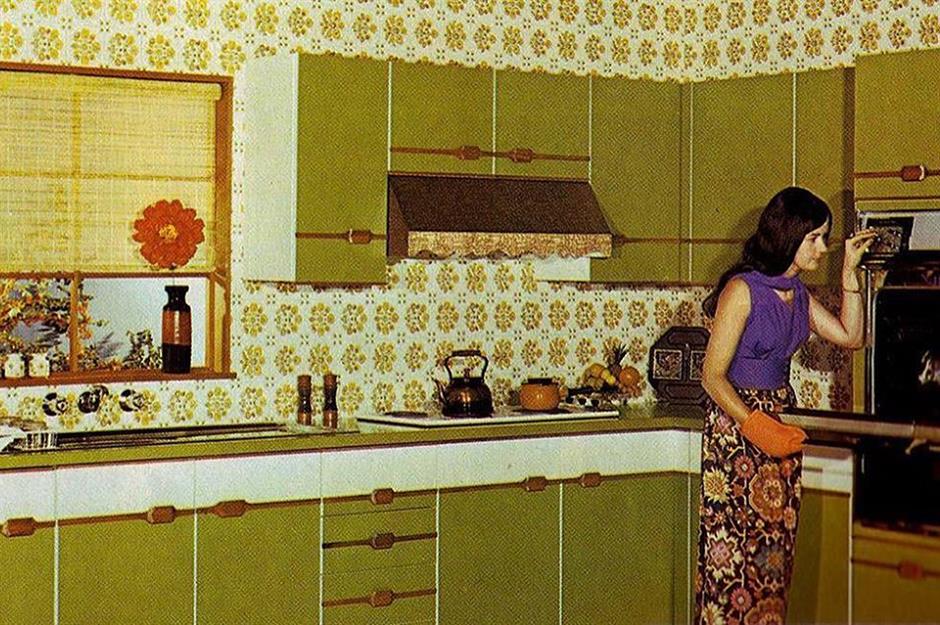
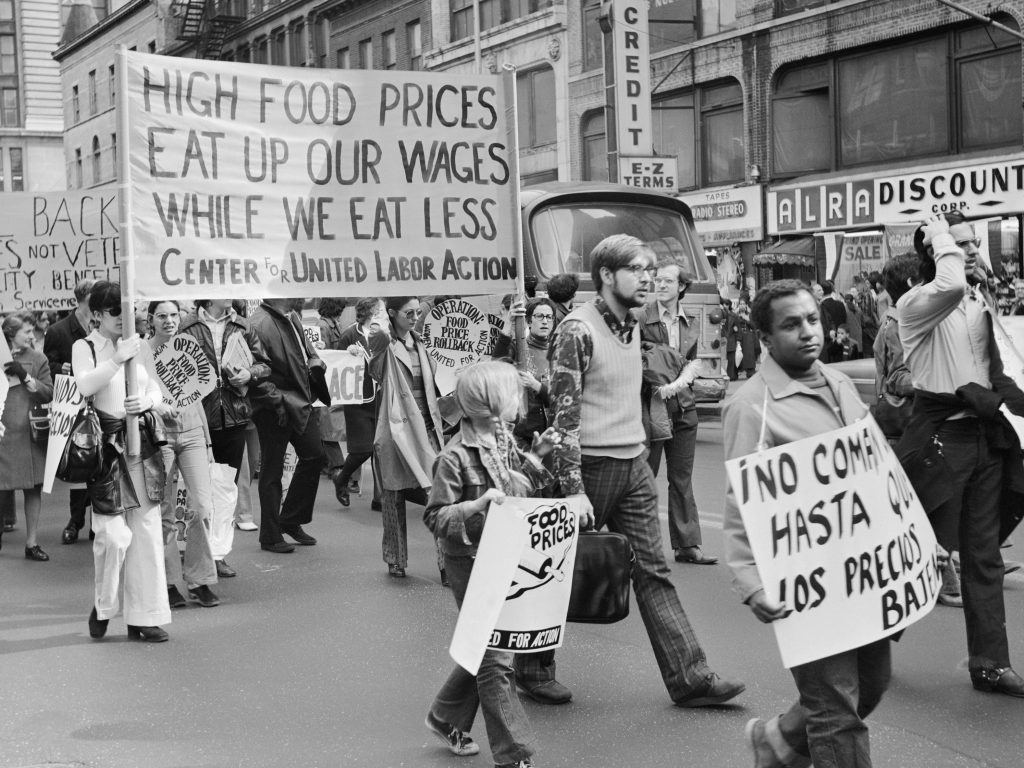
Led Zeppelin, high-waisted denim shorts, and kitchens accented with harvest gold and avocado green always came to mind when I imagined life in 1970’s America. However, this simplistic, superficial image didn’t appear to be quite congruent with the lived experience of US citizens in the seventies. Recently, when I expressed my fascination with seventies kitchen design to my father, he grimaced at me and sighed heavily. I figured he didn’t like green refrigerators, but what followed was a lecture explaining an ugly side to the seventies I hadn’t thought of before. Runaway inflation and crippling interest rates coupled with stagnating production and high unemployment that characterized the US economy in the seventies had never been seen before in America. With any luck (and smart monetary policy) it will stay in the past, much like those ostentatious kitchens.
The late seventies were a time of unprecedented economic dysfunction. We can use the macroeconomic indicators discussed in my last post–inflation rate, interest rate, unemployment rate, and real gross GDP—to determine how the US economy was faring from 1976 through 1980 (see Table 1 for annual data).
| Metric | 1976 | 1977 | 1978 | 1979 | 1980 |
| Real Gross GDP (%∆ Annually) | 4.4 | 5.1 | 6.8 | 1.3 | 0.1 |
| Inflation Rate (%∆ CPI Annually) | 5.77 | 6.47 | 7.63 | 11.25 | 13.50 |
| Unemployment Rate | 7.7 | 7.1 | 6.1 | 5.9 | 7.2 |
| Effective Federal Funds Rate (%) | 5.05 | 5.54 | 7.93 | 11.19 | 13.36 |
If we only looked at annual change in GDP; we might think the US economy was experiencing healthy annual growth in industrial production, at least until 1979: the GDP grew by only 1.3 percent in 1979, and hardly any change in GDP occurred in 1980. This indicates that a dramatic decrease in production spending occurred in 1979 and 1980. Why? The answer becomes clear when we analyze interest rates, inflation rates, and unemployment. Throughout 1976-80, inflation rates are well over target; while at first, inflation rates steadily increase, 1979 sees a jump in the rate of inflation to double digits. As expected, the Effective Federal Funds Rate (interest rate) mirrors the rate of inflation, staying within one percentage point in similarity.
Considering the sky-high inflation and interest rates throughout this time period, it would be reasonable to suggest that we would see relatively low employment, since inflation and unemployment are generally considered to be inversely proportioned. Such is not the case: unemployment rates stay above target throughout 1979-80, hovering between 5.9-7.7 percent. We see a small decrease in unemployment in 1979, only for it to jump back to 7.2% in 1980. After considering this data, there is no wonder why the nation’s production spending stagnated between 1979 and 1980: inflation and interest rates had reached double digits, crippling consumer purchasing power and ability to take out any loans.
Throughout the 50’s and 60’s, the Federal Reserve operated under the Keynesian assumption that high unemployment and inflation could not co-exist. Therefore, they attempted to keep demand for goods high and unemployment low through unsustainable monetary policy, including pumping money into the economy and keeping interest rates low. The result was a wage-price spiral (Roos 2009). Employees demanded their wages to rise along with the price of market goods, but eventually firms could no longer afford to increase wages. The result was rising unemployment along with rising inflation. This trend was solidified by the 1973 OPEC oil embargo, which caused steep price increases and shortages across nearly every US industry, plunging the economy into recession.
By the time 1978 rolled around, the US economy had undergone economic recession but was seeing a bit of economic growth despite the ever-rising inflation. We were seeing some growth in annual GDP and a small decrease in unemployment, but inflation rates were not under control, and we were far from full employment.
Recall that in 1979, the economy stagnated (change in GDP declined and unemployment rose) and inflation and interest rates hit double digits. Late 1979 saw the appointment of Paul Volker as the head of the Federal Reserve. Volker and the Fed attempted to combat inflation through militant contractionary monetary policy: they dramatically reduced the money supply, which increased interest rates (Moffat 2020). This led to a massive plunge in investment and consumption spending, lowering total aggregate expenditures in 1980. This decrease in spending led the US economy to the most severe recession seen since the Great Depression. The recessionary gap was considerably widened.
Although Volker’s actions eventually managed to break the spiral of inflation that plagued the 70’s, the short-run cost to these policies was economic recession and loss of livelihood. The phenomenon of stagflation in 1970s America was largely the result of too much expansionary monetary policy and failure to predict future inflation in the previous two decades. It is extremely unlikely that we will see the likes of stagflation in America again, as the events of the 70’s set a precedent for the Federal Reserve to change how they approached monetary policy.
References
Federal Reserve Economic Data | FRED | St. Louis Fed. https://fred.stlouisfed.org/. Accessed 13 Nov. 2020.
Moffat, Mike. “An Overview of Economic Stagflation in the 1970s.” ThoughtCo, 27 Jan. 2020, https://www.thoughtco.com/stagflation-in-a-historical-context-1148155.
Roos, Dave. “What Is Stagflation and Why Is It So Dangerous?” HowStuffWorks, 30 Nov. 2009, https://money.howstuffworks.com/stagflation.htm.