
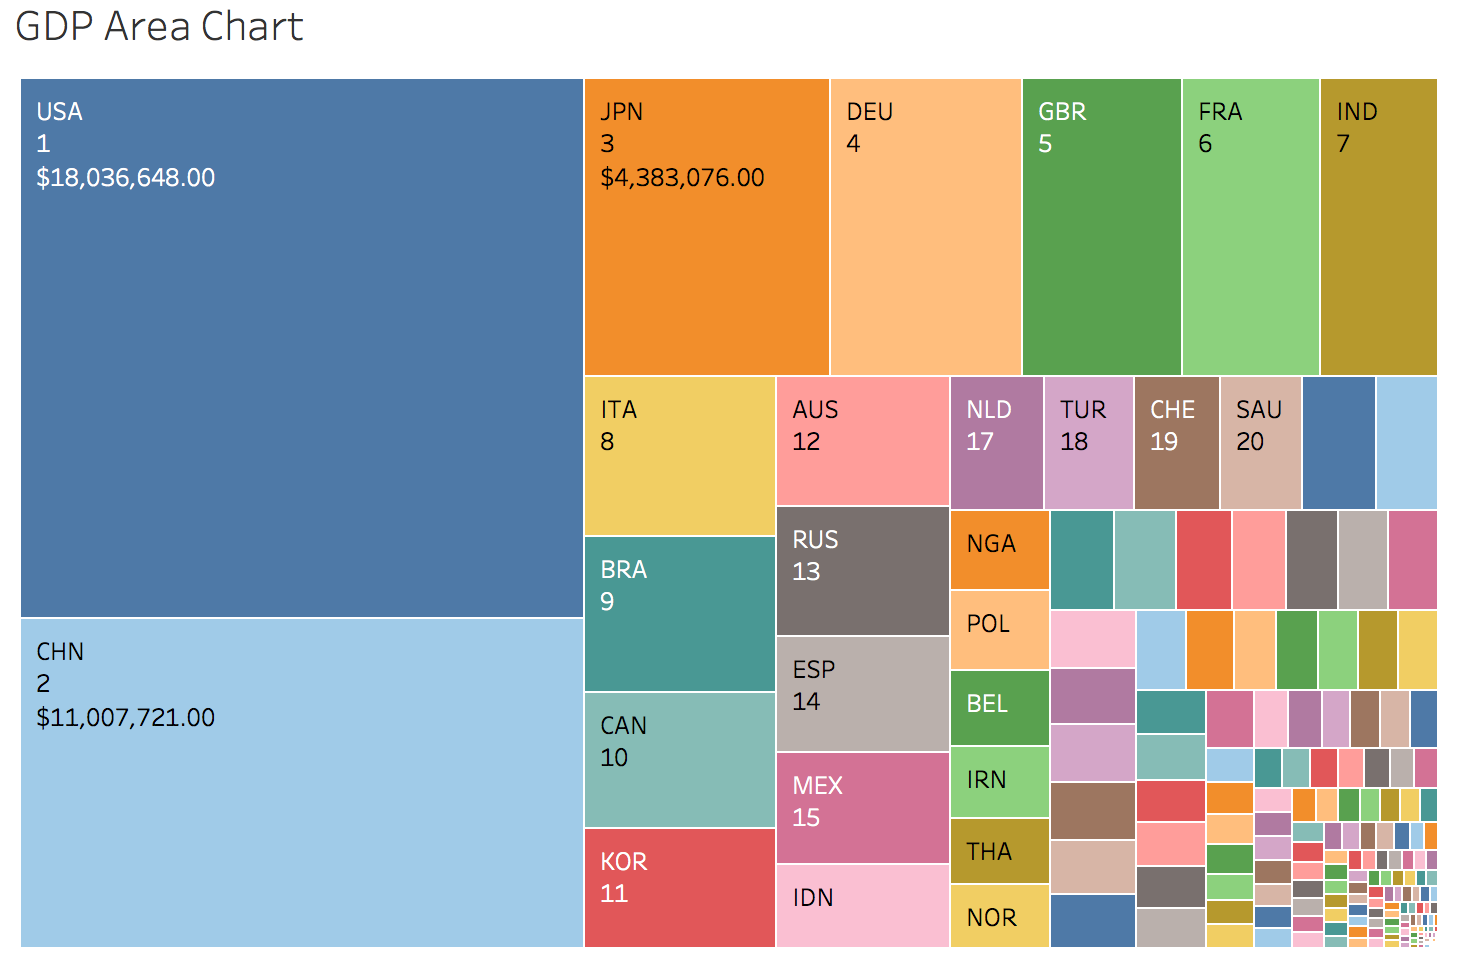
It can be difficult to visualize how big a country’s economy is. I decided to make an area chart to give us an idea of how much of the world’s output is done by only a small fraction of countries. From this, we can see that first 16 or so capture more 75% of the global GDP. That said, of these countries, some are also the largest population wise; China, India, the United States, Brazil, etc. That is a large reason why they command such large economies, but many of them are smaller, population wise.
I’ve also made a map the colors the countries’ GDP by rank.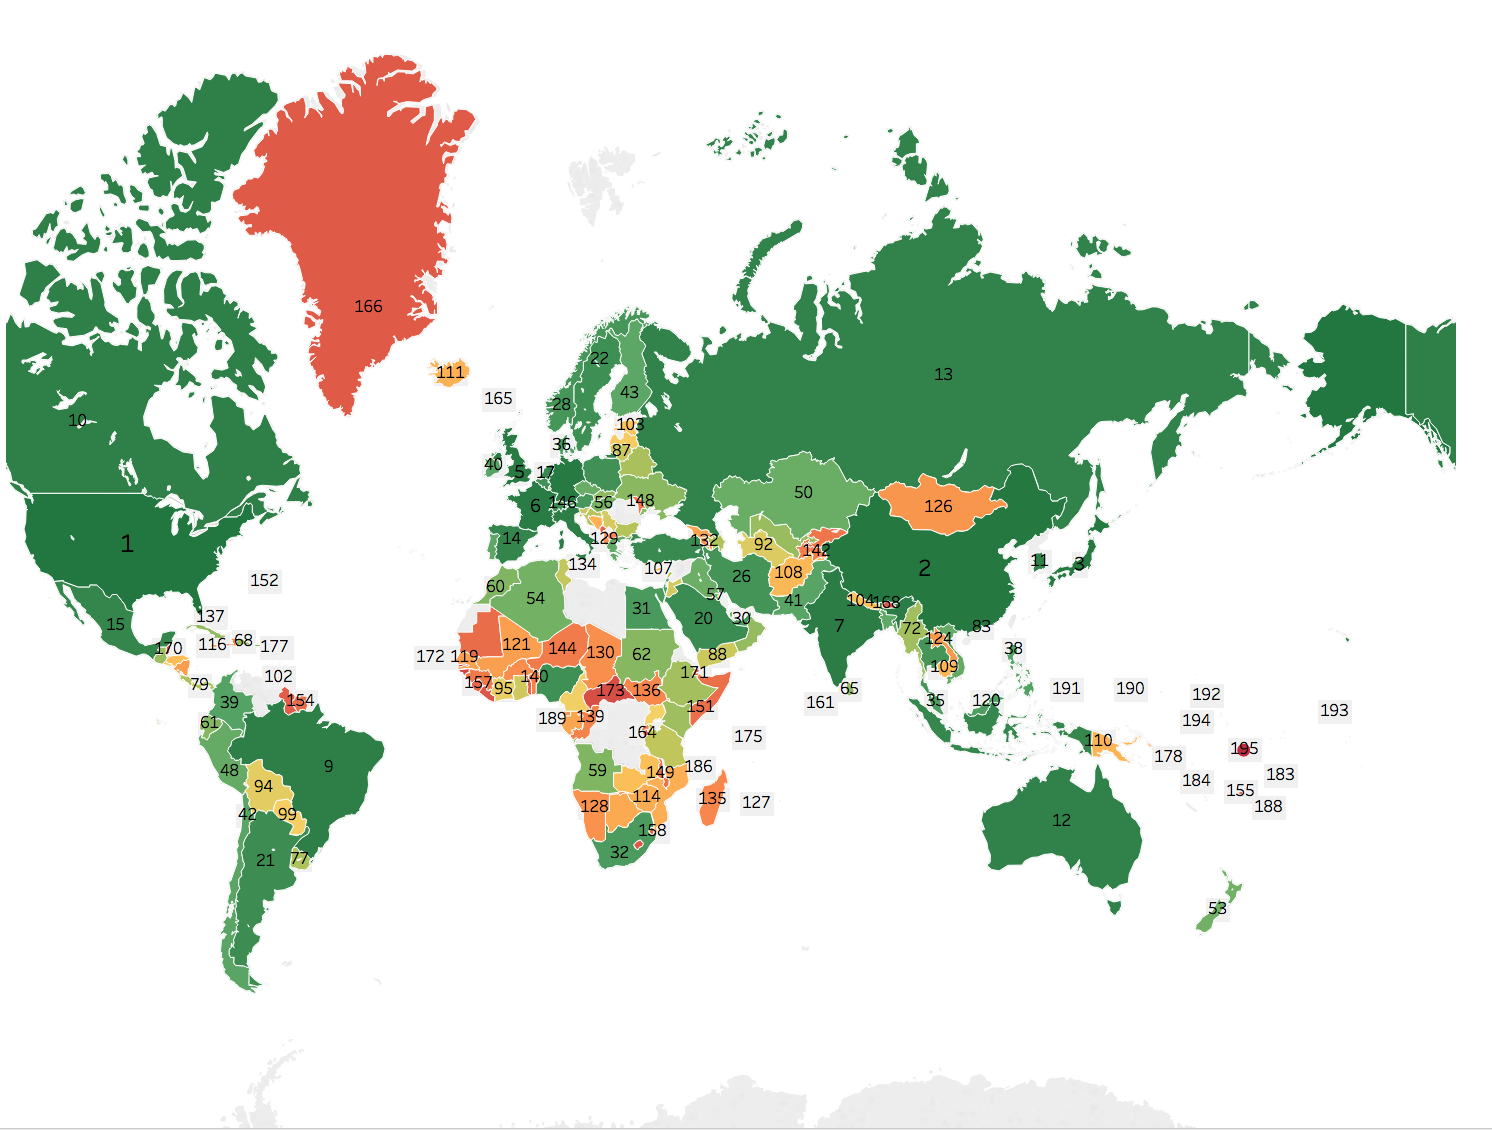 In a future post, I’ll try to capture the size of GDP per capita. It would be nice to try to capture the wealth country generates based while taking population size into account. While the United States has the largest GDP, it only has the 18th largest GDP per capita. Qatar has the largest GDP per capita, its estimated GDP is ranked 52nd for 2016.
Data Source: World Bank
Images produced on Tableau