
If you buy your own food, you may have noticed in the past couple years that food prices have been rising faster than the prices of other goods. Today, we’re going to pull apart an interview on food inflation into economic terms, that we can then turn back into real world discussion. If you’re not quite sure what inflation is yet, here’s a link to a previous post on inflation.
Here’s the interview. It’s from Marketplace, with a guy named Matthew Boesler from Business Insider. In total, it’s about 5 minutes long.
The first thing that jumps out at me is the mention of a supply side shock. Supply and demand are the hallmarks of economics, and are used to describe changes in the equilibrium price and quantity consumed in a market. Below, I drew a picture that generally shows the effect on prices when there is a negative supply shock in a market. Keep in mind that the supply curve, denoted here with S, represents the supply of all food from beef to peanut butter. Disclaimer: The shape of these do not reflect any sort of specific information about the food market, except their positive and negative slopes.
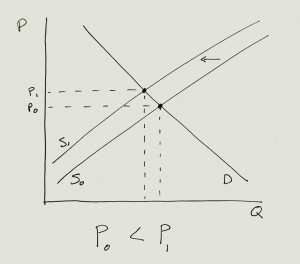
This graph says two things. First, there was a market with a equilibrium price PO. Then, there was a negative supply shock due to poor weather, which shifted the supply curve back and the new higher equilibrium price was P1. There were a couple other supply shocks that didn’t make it into this radio show, like the US hog virus and the fungus that is wiping out coffee plants in South America. Some of these supply shocks are here to stay, the ones that he mentions as “structural”. Others are based on speculation and are only as real as people believe them to be.
So what do they mean by “pass through” prices to consumers? Are producers just greedy and want to keep a high profit for themselves? Not exactly. Food producers are experiencing higher costs and thus need to raise their prices, if they want to stay in business that is. If beef farms have to start paying more for wheat to feed their cattle, that increase in input prices is “passed through” to consumers. You pay for what you get.
That being said, maybe producers realize that they can’t raise their prices. We just came out of a recession, and people don’t want to pay more for their food. Some people can’t pay more. So how do producers stay in business? Well, they can shrink their profit margin, which probably isn’t that big to start with in a competitive market, or they can cut back in other sectors of their production cost. In other words, they can cut corners on their production methods. It comes down to choosing the lesser evil, either higher prices or lower quality goods. The fact that we are experiencing higher prices makes me inclined to think that cutting corners isn’t the case here, but it very well could be.
In case you can’t get enough on this, here’s another article about where food inflation is going and how it can affect America’s economy.
Well written blog but I have some suggestions for breaking through some of the problems in the linked articles and interviews.
First of all, the micro graph you develop shows “relative” prices, and if we are talking about inflation shouldn’t we be discussing “overall” prices? Is inflation any rise in any price, or is it a rise in the price of the overall basket? I know one professor at UPS uses Case, Fair, and Oster, and that definition is on page 448.
Second, why is the CRB index in the article linked any better than the CPI Food? It seems to include less goods (“prices of hogs, steers, lard, butter, soybean oil, cocoa, corn, Kansas City wheat, Minneapolis wheat, and sugar”). It might be, I really don’t know. I’m just confused why I should be look at CRB Food instead of CPI Food. If we look at CPI Food and CPI overall the reported inflation is really not that large relative to the past. 2011 was much higher, but since then the baskets have dis-inflated. I don’t think these structural arguments are explaining the entire story of the overall changes in prices (not from a macroeconomic context), though they do explain the changes in relative prices. See the graphs from FRED (year over year change and monthly change):
http://research.stlouisfed.org/fred2/graph/?g=xvN
http://research.stlouisfed.org/fred2/graph/?g=xvP
With regards to the prices producers face, there is another data set in answer to that which no one seems to be mentioning. If the CPI is our consumer basket, then the PPI is our producer basket. It’s usually more volatile, but the story is similar with regards to “high” inflation:
http://research.stlouisfed.org/fred2/graph/?g=xvR
There was quite a bit of hand-wringing over inflation in 2011 with regards to food and energy baskets. That inflation slowed as well in 2012 and 2013. I’m not sure the interesting aspect of this are the real shock effects on the basket price of food goods as it is the (low) stability of the overall price inflation in the economy. So okay, there are real shocks, but why aren’t these affects lasting longer (for example 2011) and why aren’t they as large (compared to say 2008 or the 70s and 80s)?
The nominal part of this story could be addressed (so review the intro text on the AS-AD models). In the long run, overall price inflation is not correlated to real growth. In the short run it is (remember LRAS, SRAS, and AD). Interest rates are 0ish, so the Fed is claiming expansionary monetary policy converting long term debt to short term liquidity through QE. The US government has enacted fiscal stimulus. So where’s the inflation? Isn’t AD shifting out? One way to see if we’re actually increasing money supply (at least on the Fed’s end) is to check the monetary aggregates; you can go with the simple sum ECON100 textbook M2 aggregate (http://research.stlouisfed.org/fred2/graph/?g=xvZ), the Monetary Services Index produced by Anderson and Jones at the St. Louis Fed (http://research.stlouisfed.org/fred2/graph/?g=xt1), or the CFS monetary aggregates produced by Barnett (http://www.centerforfinancialstability.org/amfm.php). There are others if anyone wants to add more, but my preference is the CFS DM4 given its broader and is more proper aggregation based on opportunity cost of money (rather than just adding up currency and savings accounts as if they are the same thing). MSI and DM4 aren’t recovering all that well in terms of growth rate and they also contract during the recession. So if we go with the ECON100 AS-AD model, that AD shift is not as large as we might have wanted. That 2011 inflation lines up pretty nicely with the 2011 DM4 growth. It also winds down with it as 2011 progresses into 2012. The weather and bad yields are not the only thing affecting the aggregate price of food.
And of course, the Food inflation might not be a bad thing. Real GDP growth picked up a little bit and unemployment (U6 to include marginally attached workers) is not at heart-attack levels (thought still not very “recovery”ish):
http://research.stlouisfed.org/fred2/graph/?g=xw3
http://research.stlouisfed.org/fred2/graph/?g=xw5
If AD is shifting out, we should expect some inflation overall. Sometimes Food and Energy baskets get a head start. This is the “Demand pull” that is mentioned in the interview and article, but then waved away without a very satisfactory explanation.
We should consider the nominal side of this as well because policy is made based on the overall measures for a reason. If we worry about just food price levels, then we miss out on the other price changes in the overall economy. If we decide to pursue anti-inflationary measures based on the possibility that the rest of the prices in the economy will rise like food, we might put the brakes on a recovery too soon. Alternatively if we see dis-inflation or deflation in Food that is not reflected elsewhere we might enact expansionary policy and make inflation worse.
The quality argument is interesting, but not sure how to approach that from a macro level. Or get data on it.
I love the FRED site, it creates some great graphs. I think the bloggers here should give it a try and see if the articles they review are agreeing with the data.