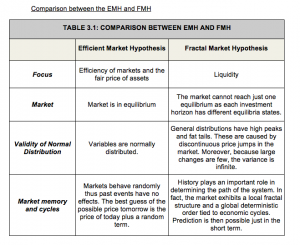
This year Eugene Fama won the nobel prize in Economics for his work on the Efficient Market Hypothesis (EMH). The idea behind his work is that it is impossible to “beat” the market, because all information about a given stock is available to everyone. That is, the EMH assumes that a stock valued at $60 is in fact worth $60: it is impossible to purchase an undervalued stock. The only way one could potentially make higher returns than the average, then, is to engage in riskier trading where bigger payoffs are possible. Investopedia offers a neat little video overview of the EMH; and, as it points out, there are some potential problems with this hypothesis. For example, some investors interpret information differently, and so they will value stocks differently. Another issue some have with the EMH is that some investors have beat the market before (e.g., Warren Buffett). As it turns out, there are some who think an alternate hypothesis may be able to account for many of the problems in Fama’s award winning work.

Notice that the zoomed in view of Sierpinski’s triangle is identical to what it looks like on a large scale
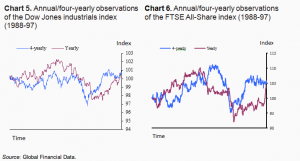
An article last month by Nicola Anderson and Joseph Noss explains this alternative, the “Fractal Market Hypothesis”. For those unfamiliar with fractals, they are objects which have self-similar qualities. Plainly speaking, a fractal is an object that resembles itself on different scales, such as the Sierpinski’s Triangle. According to the Fractal Market Hypothesis (FMH), market prices follow a fractal pattern. In other words, when one looks at prices over different time scales, the graphs resemble each other.
What causes this self-similarity is the interaction between investors purchasing on different time-horizons.
“For example, for investors with short-term horizons, such as some hedge funds, the daily distribution of returns may have a large bearing on their trading behavior. In particular, a fall in prices commensurate with, say, three standard deviations of daily returns might be seen as highly adverse precipitating a sell. But to a longer-term investor — for example, ‘real money’ investors such as pension funds — these daily high and lows may be less important.”

This interaction between varying time horizons shifts focus away from a market with efficient information, purposed in the EMF, and towards a liquid market where short and long term investors can always step in to make investments. Furthermore, the market anomalies and discontinuous nature of prices can be accounted for in the FMH.

For more details on both fractals and the Fractal Market Hypothesis, try looking at the article referenced above. For an in-depth look at the FMH and the EMH within a more historical context, check out Tania Velasquéz’s 2009 student thesis.
