Welfare benefits are a point of contention for lawmakers and consumers alike. Some states have been mulling over changing their welfare policies, most of which are aimed at controlling what the poor spend their food stamps and welfare checks on. Some politicians are worried that the poor take government money and spend it on non-essentials (concerns include welfare checks being spent at strip clubs and food stamps being used for filet mignon – I’m not kidding).
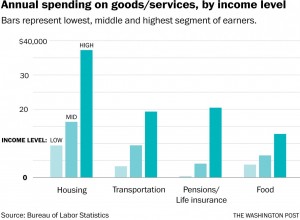
To help put those fears to rest, the Bureau of Labor Statistics recently updated their consumer expenditure survey. The consumer expenditure survey shows how much individuals from various income brackets spend on goods and services. The tables are simplified in this Washington Post article, where income brackets are segmented into low, medium and high and spending is broken up into food, housing, pension/life insurance and transportation.
As expected, the high income individuals spend more than the other two income brackets. I think we can chalk that up to said individuals having more money to spend. Also the higher income individuals spend less of their total income, but mostly because the higher incomes are higher. However, when it comes to groceries consumers spend about the same on different types of food. Granted the rich spend more on groceries and the poor spend less, but both high and low income consumers spend about 19% of their budget of produce, 22% percent on meats and between 3 and 4% on seafood and fish. Unless there’s some secret discount on lobster and filet mignon for those with lower incomes (if there is, hook me up), it’s unlikely that most of those receiving government assistance are blowing it all on fancy steak and shellfish. As for recreational spending. The rich spend a lot more on alcohol and eating out, while the poor are still spending money on cigarettes.
Another major difference in saving. The rich tend to have more disposable income, and are often left with more money at the end of the day. High income consumers invest a significantly larger portion of their budget on insurance. It’s hard to bridge the income gap when the poor have no money left to save at the end of the month while the rich get richer investing their extra money. And as the rich keep saving their money, those lower on the income scale (i.e. those that provide goods/services to the rich) are not being paid. The most important thing to take away from the BLS survey is that the poor are (on average) not taking advantage of government assistance. To combat inequality, we shouldn’t be focusing on making government assistance for lower-income individuals even harder to obtain – instead we should be encouraging the poor to save and the rich to spend. How to do this? That’s another issue entirely.


“… when it comes to groceries consumers spend about the same on different types of food …” Well, this seems a surprise not only from the perspective of the Veblen and Giffen paradoxa, but mostly leads me to another suspicion: the consumer survey I know of are self-recorded expenditure sheets (now often done via computer forms if the families have access) and … the typical bias here is that the families that voluntarily participate in such arduous self-reporting schemes (you have to literally go through each and every cash receipt from any supermarket, gas station etc. etc. and write the item and price and amount bought into that form – costs you several hours per week!) are likely of a similar frame of mind. The much more interesting study for a PH.D. sociology candidate would be to follow such reporting families over a few years to see if they don’t change “poverty levels”, i.e. eventually rise from lower to higher strata, simply BECAUSE they critically reflect what they are doing?!